Creating TrackToAct Dashboards in Excel

Pieter van der Westhuizen, a professional freelance web & mobile developer and founder of Coalition Software.
So far I’ve shown you a lot of the technical side of TrackToAct, so if you’re a programmer I hope you’re starting to get a better idea of how you can incorporate TrackToAct into your applications. Today I’ll show the guys interested in selling and marketing the product some kindness by looking at getting a Full Funnel view of anonymous users.
We’ll start by visualizing your TrackToAct data using Microsoft Excel in order to gain valuable insight into how people use your products.
Viewing TrackToAct Data in Microsoft Excel
Downloading your TrackToAct data into Microsoft Excel is much easier than it sounds, by using the built-in Excel templates. After logging into your TrackToAct account, navigate to the Advanced page. From there you can download a powerful Excel dashboard template.
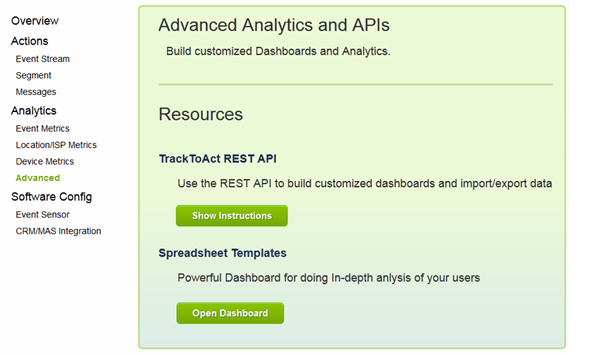
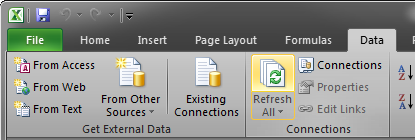
TrackToAct will take care of setting up the connection to your session and usage data; all you need to do is hit the Refresh All button on the Excel Data Ribbon Tab.
Interpreting the data
The spreadsheet templates retrieve data from the TrackToAct servers. There is a worksheet that contains ‘raw’ events and other worksheets that use pivot tables and charts to visualize funnel and conversion metrics We’ll create a pivot table in Excel to give us an overview of how our product is downloaded, installed, used and then either installed or if a licence is bought.
Excel data should look as follows:
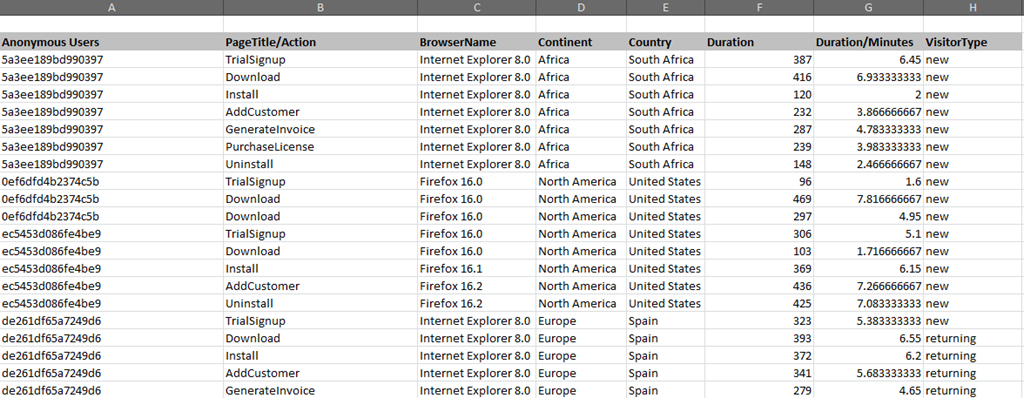
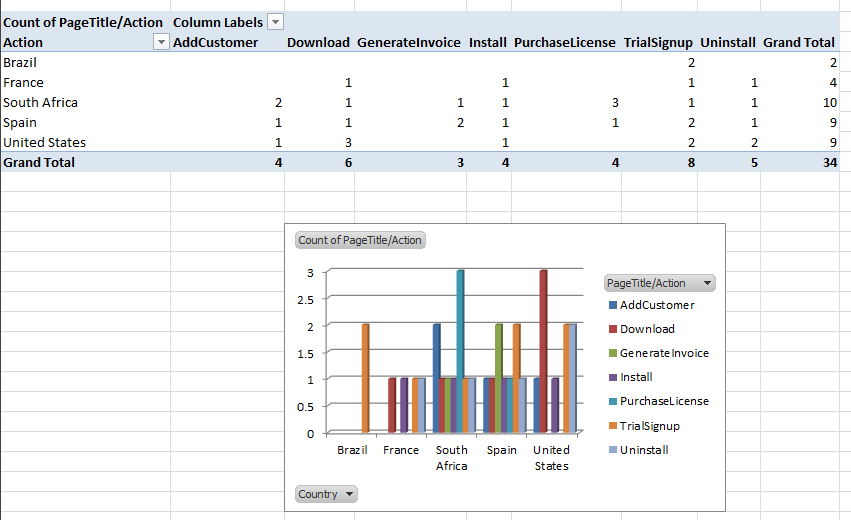
Using this data we’ll build an Excel Pivot table to give us a clearer view of how people are downloading and using our application.
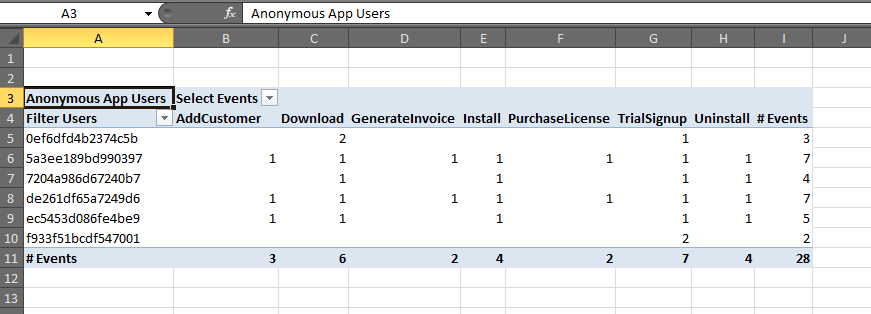
A lot of insight can be gained with this view, for example, we can see that one user downloaded the trial version twice but never installed the application, another user had signed up for a trial twice but never downloaded the application.
Using this data you can quickly start to investigate why users are not installing your application, you’ll need to ask yourself such questions as, “Is the sign-up form too long or difficult to understand?” and “Is the download size too big?”
If you’ve collected the user’s e-mail address on the signup page and noticed that they never downloaded or installed your application, you can quickly send them a follow-up e-mail to hear if they would like some assistance with the installation. This is a great way to keep potential customers engaged and turn them into paying users.
Build insightful reports with Excel
Of course another huge benefit of using Excel with TrackToAct is the great charts and reports you would be able to generate as per the two examples below:
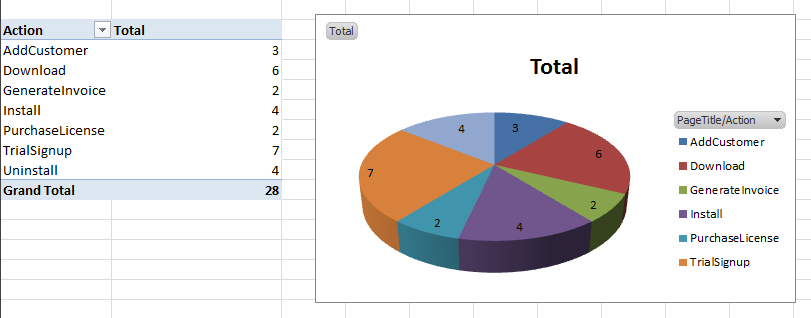
I’m sure by now you can see the value in the data TrackToAct can collect on your behalf as well as the incredible insight into user experience and usage patterns.
Thank you for reading and do not forget to head over to the TrackToAct website to sign up for your free account.
This was a paid-for article brought to you by TrackToAct.